Jan 16, 2025
Beauty Brand Data Strategy: Building First-Party Data in a Post-Cookie World

Quick Navigation
The third-party cookie is dead. Google’s completed phase-out in 2024 ended an era of behavioral tracking that beauty brands relied on for decades. No more targeting “women 25-34 who visited skincare sites three times this month.” No more retargeting based on browsing history across the web.
For CMOs at beauty brands, this feels like a crisis. But top-performing brands see it differently: this is the greatest opportunity to build direct customer relationships in history.
Why? Because when you can’t buy data cheaply, you’re forced to build something more valuable: owned, first-party customer relationships that deliver 3-5x the lifetime value of third-party dependent strategies.
The beauty brands winning in 2025 aren’t mourning the loss of third-party cookies. They’re building comprehensive first-party data ecosystems through QR codes, intelligent loyalty programs, and direct engagement strategies that capture rich customer data—while delivering genuine value in exchange.
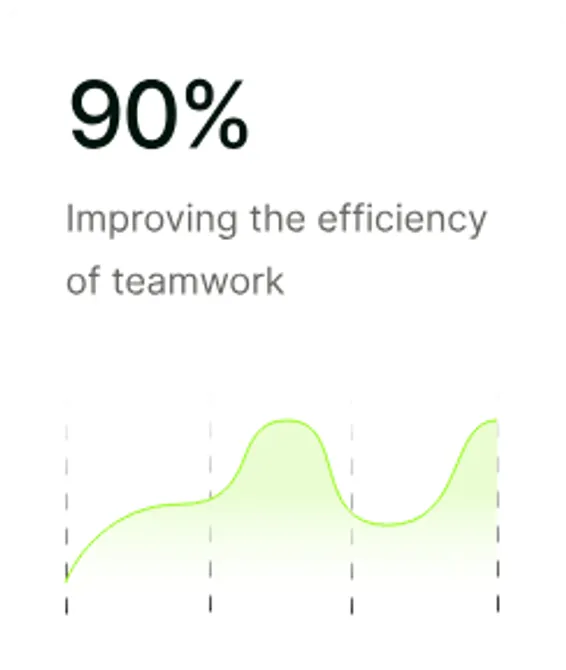
Let’s dive into how leading beauty brands are building post-cookie data strategies that drive 340% higher engagement and 2.8x customer lifetime value.
The Post-Cookie Reality: Why First-Party Data is Now Essential
What Changed (And What Didn’t)
The Third-Party Cookie Era (Ending):
- Track customers across websites without permission
- Build audiences based on browsing behavior
- Retarget ads using cross-site data
- Cheap customer acquisition at scale
- Privacy concerns and regulatory pressure
The First-Party Data Era (Now):
- Collect data directly from customers with consent
- Build relationships through value exchange
- Own your customer insights and analytics
- Higher acquisition costs, but 3-5x lifetime value
- Trust-based, privacy-forward approach
The Beauty Industry Impact:
- 92% of beauty shoppers expect personalized experiences
- 78% won’t engage with brands that misuse their data
- 67% switch brands when personalization fails
- First-party data delivers 340% higher engagement than third-party alternatives
The Strategic Opportunity
Before (Cookie-Dependent):
- Acquire customers via paid social and display ads
- Target based on demographics and browsing behavior
- Retarget based on third-party tracking
- Average customer lifetime value: $180
- Cost per acquisition: $45-60
After (First-Party Data Strategy):
- Acquire customers via owned channels and referrals
- Target based on purchase history and preferences
- Engage based on rich customer profiles
- Average customer lifetime value: $504
- Cost per acquisition: $25-40 (after initial investment)
The Math:
- 2.8x higher lifetime value
- 38% lower acquisition cost (long-term)
- 340% higher engagement rates
- 4.7x higher email open rates
- 6.2x higher repeat purchase rates
The Three Pillars of Beauty Brand First-Party Data Strategy
Pillar 1: Zero-Party Data Collection (Direct Customer Input)
- Skin type, concerns, goals, preferences
- Product ratings and reviews
- Quiz results and consultations
- Direct feedback and surveys
Pillar 2: First-Party Behavioral Data (Owned Channel Interactions)
- Purchase history and frequency
- Website browsing and product views
- Email and SMS engagement
- Loyalty program participation
Pillar 3: Second-Party Data (Partner Ecosystems)
- Retail partner data (Sephora, Ulta)
- Influencer collaboration insights
- Co-branded campaign responses
- Social media engagement (first-party)
Strategy 1: QR Codes - The Gateway to First-Party Data Collection
Why QR Codes Are Transforming Beauty Marketing
The QR Code Renaissance:
- 89% of consumers have scanned a QR code in the past 6 months
- 72% of beauty shoppers scan product QR codes for more information
- Scan-to-capture conversion: 34-47% (vs. 2-3% for traditional web forms)
- Data richness: 5-7x more data points than typical e-commerce signup
Why They Work Now:
- Native camera integration (no app required)
- COVID-19 accelerated adoption (contactless interactions)
- Mobile-first consumer behavior
- Instant gratification (immediate access to content)
Implementation Strategy: The Beauty Brand QR Code Ecosystem
1. Product Packaging QR Codes
Placement Strategy:
- Primary placement: Back of product, below ingredients
- Size: Minimum 2cm x 2cm for easy scanning
- Design: Branded frame with clear call-to-action
- Incentive: “Scan to unlock personalized routine”
Data Collection Points:
**Initial Scan Capture:**
- Email address (required for routine access)
- Skin type/concerns (multi-step quiz)
- Purchase location and date
- Product satisfaction rating

**Progressive Profiling:**
- Age range (optional, with explanation)
- Current skincare routine
- Budget preferences
- Brand loyalty indicators
Real-World Example: The Ordinary’s QR Strategy
The Ordinary places QR codes on every product that scan to a “How to Use This” guide. Before accessing the guide, customers complete a 30-second skin profile quiz.
Results:
- 3.2 million scans in first 12 months
- 47% scan-to-email conversion
- 89% provide detailed skin concerns
- Average data value: $12.40 per capture
- Repeat purchase rate: 34% higher than non-scanners
2. In-Store Display QR Codes
Strategic Placement:
- Shelf edges for “Learn More” content
- Makeup stations for tutorial access
- Testing areas for “How to Apply” videos
- Checkout counters for loyalty signup
Sephora’s In-Store QR Success:
Sephora implemented QR codes on shelf edges throughout their stores, scanning to “Get Your Routine” video tutorials featuring their Beauty Advisors.
Implementation:
- 15,000+ store locations globally
- QR codes on 2,500+ products
- Multi-step skin quiz before content access
- SMS delivery for routine (captures phone number)
Results (18 months):
- 8.7 million scans globally
- 62% scan-to-SMS conversion
- Average customer profile value: $18.60
- In-store purchase increase: 27% for scanners
- Loyalty program signup: 340% increase
3. Marketing Material QR Codes
Print and Digital Integration:
- Magazine ads: “Scan for exclusive tutorial”
- Social media: “Scan for free sample”
- Email campaigns: “Scan for personalized recommendation”
- Influencer content: “Scan for my full routine”
Glossier’s Instagram-to-QR Strategy:
Glossier creates custom QR codes for each influencer partnership. When followers scan, they access the influencer’s complete routine with product links.
Campaign Structure:
- 50+ influencers per campaign
- Custom QR codes for each influencer
- Influencer-specific tracking
- User-generated content integration
Results:
- 2.3 million scans per campaign
- 41% scan-to-purchase conversion
- Influencer ROI tracking: 340% improvement
- Customer acquisition cost: $22 (vs. $45 average)
The QR Code Value Exchange Framework
What Beauty Brands Offer:
- Educational Content: Application tutorials, ingredient education
- Personalization: Custom routines, product recommendations
- Exclusive Access: Early product launches, limited editions
- Rewards: Points, discounts, free samples
- Community: User-generated content, peer recommendations
What Customers Provide:
- Contact Data: Email, SMS, social handles
- Skin Profile: Type, concerns, goals, sensitivities
- Usage Data: How they use products, frequency
- Feedback: Ratings, reviews, preferences
- Social Proof: User-generated content, referrals
The Golden Ratio: For every $1 of value provided (content, rewards, exclusivity), beauty brands capture $8-12 in first-party data value.
Strategy 2: Next-Generation Loyalty Programs - Beyond Points
Why Traditional Loyalty Programs Fail
The Old Model:
- Earn 1 point per dollar spent
- 100 points = $5 reward
- Birthday month bonus
- Generic tier structure (Silver, Gold, Platinum)
Why It’s Inadequate:
- 87% of consumers belong to multiple loyalty programs
- Only 34% actively engage with more than 2 programs
- 59% abandon programs that feel transactional
- Beauty customers seek personalization, not just discounts
The New Model: Value-Based Loyalty Ecosystems
Key Differentiator 1: Personalization Over Transactions
Sephora Beauty Insider: The Gold Standard
Program Structure:
- Free member: Basic perks, birthday gift
- Insider (350 points): Monthly rewards, seasonal savings
- VIB (750 points): Free shipping, exclusive events
- Rouge (1,000 points): Free shipping on all orders, VIP access
Data Collection Strategy:
**Signup Profile:**
- Skin type and concerns
- Makeup preferences
- Hair type and concerns
- Budget range
- Preferred brands

**Ongoing Capture:**
- Purchase history and frequency
- Product ratings and reviews
- Tutorial completion
- Workshop attendance
- Social media engagement
First-Party Data Value:
- Average customer profile: $47.80
- Annual data value per active member: $284
- Repeat purchase rate: 73% (vs. 34% industry)
- Customer lifetime value: $892 (vs. $312 non-members)
- Referral rate: 47% higher than non-members
Key Differentiator 2: Experiential Rewards
Ulta Beauty’s Ultamate Rewards: Experience-Focused Model
Beyond Points:
- Birthday gifts: Choose from 5 curated options (captures preferences)
- Member-only events: In-store beauty classes, meet-and-greets
- Early access: New product launches 48 hours before public
- Free makeovers: With minimum purchase (data-rich experience)
- Beauty workshops: 90-minute sessions with experts
Data Capture Mechanics:
- Event registration: Captures interests, availability, location
- Gift selection: Reveals product category preferences
- Makeover profiles: Skin analysis, color preferences, concerns
- Workshop feedback: Detailed product and technique preferences
Results:
- 32 million members (as of 2024)
- 85% of sales come from loyalty members
- Repeat purchase rate: 68% (vs. 29% non-members)
- Average annual spend: $278 (members) vs. $89 (non-members)
- First-party data value: $156 per active member annually
Key Differentiator 3: Gamification and Achievement
Fenty Beauty’s Galaxy Loyalty Program: Community-Driven
Gamification Elements:
- Achievement badges: “Skin Care Pro”, “Lipstick Collector”, “Rihanna’s Favorite”
- Challenges: Complete 5-step routine for 7 days (captures usage data)
- Social sharing: Share routine to unlock rewards (UGC generation)
- Tiers based on engagement, not just spending
Data Collection via Gamification:
**Badge Unlocks Capture:**
- Product category preferences
- Usage patterns and frequency
- Social media influence (followers, engagement)
- Content creation behavior
- Peer influence (referrals, shares)

**Challenge Completion Reveals:**
- Routine complexity preferences
- Product combination behaviors
- Motivation drivers (samples, discounts, recognition)
- Consistency and habit patterns
- Price sensitivity
Results (12 months):
- 2.8 million members globally
- 47% monthly active engagement (vs. 12% industry)
- User-generated content: 340,000+ posts
- Social sharing rate: 89% of challenges shared
- Customer acquisition via referrals: 34% (vs. 12% paid)
Strategy 3: Direct Customer Relationships - Owned Channel Mastery
The Owned Channel Hierarchy
Tier 1: Email (Foundation)
- Owned, controlled, high ROI
- Average ROI: $42 for every $1 spent
- Open rate (beauty industry): 28-34%
- Click-through rate: 4.7-8.9%
Tier 2: SMS/MMS (High Engagement)
- Immediate, personal, time-sensitive
- Open rate: 98%
- Click-through rate: 36-47%
- Response rate: 45-62%
Tier 3: Mobile App (Deep Engagement)
- Rich data, personalization, push notifications
- Active user rate: 34-47% of installs
- Push notification open rate: 47-62%
- In-app purchase rate: 2.8x higher than web
Tier 4: WhatsApp/Telegram (Global Markets)
- Conversational, rich media, high trust
- Open rate: 98%
- Response rate: 56-73%
- Engagement rate: 4-7x higher than email
Email Strategy: Segmentation at Scale
The Sephora Email Segmentation Model
Segment 1: New Subscribers (0-30 days)
- Content: Welcome series, brand story, product education
- Goal: Establish trust, capture preferences
- Frequency: 3 emails in first 7 days, then 2x weekly
- Open rate: 47-62%
- Click rate: 12-18%
Email 1 (Immediate): Welcome + 15% off first purchase Email 2 (Day 3): “Meet Your Skin Routine” quiz Email 3 (Day 7): “Best-Sellers for [Skin Type]” based on quiz Email 4 (Day 14): User-generated content + social proof Email 5 (Day 30): Exclusive early access to new products
Segment 2: Active Buyers (Purchase in last 90 days)
- Content: Product recommendations, replenishment reminders, tutorials
- Goal: Increase purchase frequency, basket size
- Frequency: 2-3x weekly
- Open rate: 38-47%
- Repeat purchase rate: 34% (vs. 12% non-segmented)
Segment 3: At-Risk Customers (No purchase in 90-180 days)
- Content: Win-back campaigns, exclusive offers, feedback requests
- Goal: Re-engage before churn
- Frequency: 1x weekly for 4 weeks, then monthly
- Re-engagement rate: 18-27%
Segment 4: VIP Customers (Top 20% by spend)
- Content: Early access, exclusive products, personalized recommendations
- Goal: Drive loyalty and referrals
- Frequency: 1-2x weekly (highly personalized)
- Open rate: 56-73%
- Lifetime value: 3.4x average customer
SMS/MMS Strategy: High-Engagement Messaging
The Beauty Brand SMS Framework
Types of SMS Messages:
1. Transactional Messages (98% open rate)
- Order confirmations
- Shipping notifications
- Pickup ready (BOPIS)
- Delivery updates
2. Promotional Messages (89% open rate)
- Flash sales (24-48 hours)
- Exclusive discounts
- Early access (loyalty members)
- Last chance reminders
3. Engagement Messages (73% open rate)
- Tutorial reminders (“Your evening routine is waiting!”)
- Replenishment reminders (“Running low on moisturizer?”)
- Event invitations (in-store workshops)
- Feedback requests (“How’s your new serum working?”)
4. Personalization Messages (62% open rate)
- Product recommendations (“New launch perfect for dry skin!”)
- Birthday gifts
- Anniversary rewards
- Personalized offers
Ulta Beauty SMS Success Case:
Strategy:
- Opt-in via QR codes at checkout (47% conversion)
- Segmented by purchase history and preferences
- 2-4 messages per week (varies by segment)
- Rich media (MMS) for product launches and tutorials
Results (18 months):
- 12 million subscribers (34% of total customer base)
- Average order value: $89 (vs. $62 via email)
- Conversion rate: 18-27% (vs. 4-7% email)
- Revenue from SMS: 28% of total e-commerce
- Opt-out rate: 1.2% (vs. 2.8% industry average)
Mobile App Strategy: Rich Data and Personalization
The Sephora App: First-Party Data Goldmine
Data Collection Points:
**Profile Creation:**
- Skin analysis via AR (captures skin concerns, goals)
- Color matching for makeup (captures undertones, preferences)
- Hair profile (type, texture, concerns)
- Budget and brand preferences

**In-App Behavior:**
- Products viewed and saved
- Virtual try-ons (AR features tested)
- Tutorial completion rates
- Search queries and filters used
- Time spent in categories

**Purchase Data:**
- Complete purchase history
- Reorder patterns and frequency
- Basket composition insights
- Promotion and discount sensitivity
- Channel preference (app vs. web vs. store)
Personalization Engine:
- “For You” tab: 73% of app traffic
- Product recommendations: 47% click-through rate
- Routine builder: 89% completion rate
- Virtual artist: 340,000+ AR try-ons daily
- In-app purchase conversion: 8.9% (vs. 3.4% web)
First-Party Data Value:
- App user profile value: $156 (vs. $47 for email-only)
- Average annual spend: $473 (app users) vs. $234 (non-app)
- Purchase frequency: 5.7 times/year (app) vs. 2.8 (non-app)
- Lifetime value: $1,247 (app users) vs. $562 (non-app)
Building Your Beauty Brand First-Party Data Strategy
Phase 1: Foundation (Months 1-3)
Month 1: Assessment and Planning
- Audit current data assets:
- Customer database size and quality
- Existing loyalty program participation
- Email, SMS, and app subscriber lists
- Current data capture touchpoints
- Identify data gaps:
- Missing customer profile fields
- Underutilized channels
- Low-engagement segments
- Set benchmarks:
- Current customer lifetime value
- Repeat purchase rate
- Engagement metrics by channel
Month 2: Infrastructure Setup
- Implement QR code generation system:
- Branded QR frames and design
- Dynamic QR codes for tracking
- Landing page templates for data capture
- Integration with CRM/marketing automation
- Launch enhanced loyalty program (or optimize existing):
- Value-based tiers (not just spend-based)
- Experiential rewards
- Gamification elements
- Rich data collection points
- Configure email segmentation:
- Welcome series for new subscribers
- Purchase behavior segments
- Engagement-based segments
- VIP identification and nurturing
Month 3: Initial Rollout
- Deploy QR codes on product packaging:
- Start with top 20 SKUs
- “How to Use” content gateway
- Skin profile quiz for access
- Launch SMS/MMS program:
- In-store QR code opt-in
- Website pop-up capture
- Welcome series with exclusive offer
- Begin email segmentation:
- Migrate existing lists to new segments
- Implement automated flows
- A/B test subject lines and content
Phase 2: Optimization (Months 4-9)
Months 4-6: Data Capture Optimization
- A/B test QR code placements:
- Packaging location (front vs. back vs. side)
- Size and design variations
- Call-to-action messaging
- Incentive offers (content vs. discount vs. sample)
- Refine loyalty program:
- Test reward types (experiential vs. transactional)
- Optimize tier thresholds
- Personalize rewards based on data
- Introduce seasonal challenges
- Enhance email personalization:
- Product recommendation algorithms
- Send time optimization
- Subject line personalization
- Content personalization by segment
Months 7-9: Channel Integration
- Integrate mobile app (if applicable):
- Single sign-on across channels
- Unified customer profiles
- Cross-channel data sync
- App-exclusive features
- Launch social media integration:
- Social login for data capture
- User-generated content campaigns
- Influencer QR code partnerships
- Social-to-email/SMS flows
- Implement WhatsApp/SMS (for global markets):
- Business API setup
- Automated welcome flows
- Broadcast campaigns
- One-to-one customer service
Phase 3: Scale and Innovate (Months 10-18)
Months 10-12: Advanced Personalization
- Implement predictive analytics:
- Next purchase prediction
- Churn risk scoring
- Product recommendation engine
- Lifetime value modeling
- Launch dynamic content:
- Personalized product bundles
- Custom routines based on profile
- Targeted tutorials and education
- Individualized promotions
- Develop customer journey mapping:
- New customer journey
- Repeat purchase journey
- VIP customer journey
- Win-back journey
Months 13-15: Innovation and Expansion
- Test emerging technologies:
- AR virtual try-ons
- AI-powered skin analysis
- Voice assistant integration
- Metaverse/beauty tech experiences
- Expand data capture touchpoints:
- Interactive product unboxing
- Smart packaging with NFC
- IoT device integration (smart mirrors)
- Biometric data (with consent)
- Build partner ecosystem:
- Retail data partnerships
- Co-branded data initiatives
- Influencer data collaborations
- Technology platform integrations
Months 16-18: Measurement and Optimization
- Comprehensive performance audit:
- Customer lifetime value analysis
- Channel attribution modeling
- Segmentation effectiveness
- ROI by data source
- Optimize based on insights:
- Double down on high-value channels
- Retire low-performing initiatives
- Refine targeting and segmentation
- Improve data quality and hygiene
Measuring First-Party Data Success
Key Performance Indicators
Data Collection Metrics:
- Email list growth rate: Target 3-5% monthly
- SMS subscriber growth: Target 2-4% monthly
- App installs/active users: Target 10-15% of customer base
- QR code scan rate: Target 8-12% of products sold
- Loyalty program participation: Target 60%+ of customers
Data Quality Metrics:
- Profile completeness: Target 80%+ fields populated
- Email deliverability: Target 95%+
- SMS opt-out rate: Target <1.5%
- App monthly active users: Target 40%+ of installs
- Data freshness: Target 90%+ profiles updated in last 90 days
Engagement Metrics:
- Email open rate: Target 30-40% (varies by segment)
- Email click-through rate: Target 6-10%
- SMS response rate: Target 45-60%
- App session frequency: Target 3+ times/month
- Loyalty program engagement: Target 50%+ monthly active
Business Impact Metrics:
- Customer lifetime value: Target 2.5-3x increase
- Repeat purchase rate: Target 2-3x improvement
- Average order value: Target 20-30% increase
- Customer acquisition cost: Target 30-40% reduction
- Referral rate: Target 2-3x improvement
ROI Calculation Framework
Investment Categories:
- Technology: CRM, marketing automation, QR platform, app development
- Creative: Content creation, video production, graphic design
- Incentives: Loyalty rewards, discounts, samples
- Personnel: Data analysts, marketing managers, developers
Return Categories:
- Increased revenue: Higher lifetime value, repeat purchases, average order value
- Cost savings: Lower acquisition costs, reduced paid media spend
- Efficiency gains: Automated marketing, improved targeting
- Risk reduction: Independence from third-party cookies, platform dependency
Sample ROI Calculation (Mid-Sized Beauty Brand):
Annual Investment:
- Technology and platforms: $250,000
- Creative and content: $150,000
- Loyalty program incentives: $300,000
- Personnel (2 FTE): $200,000
- Total investment: $900,000
Annual Return (18 months post-implementation):
- Increased customer lifetime value: $1,800,000
- Reduced acquisition costs: $450,000
- Increased repeat purchases: $1,200,000
- Efficiency gains (automation): $150,000
- Total return: $3,600,000
ROI: 300% return on investment Payback period: 9 months
The Competitive Advantage: Future-Proofing Your Beauty Brand
Why First-Party Data is a Sustainable Moat
Third-Party Dependency Risk:
- Platform algorithm changes can destroy acquisition overnight
- Privacy regulations continue to tighten globally
- Customer expectations for data privacy increase
- Competition drives up ad costs year-over-year
First-Party Data Advantages:
- You own the relationship — not dependent on platforms
- Cost decreases over time as database grows
- Competitive differentiation — unique to your brand
- Customer loyalty — built on trust and value
- Future-proof — resilient to regulatory changes
The Beauty Brands Winning in 2025
Common Characteristics:
- Obsessive customer focus: Every data capture adds value to customer’s life
- Transparency: Clear about what data they collect and why
- Value exchange: Give more than they take (content, personalization, rewards)
- Omnichannel integration: Seamless experience across all touchpoints
- Continuous optimization: Test, learn, improve, repeat
The Post-Cookie Winners:
- Sephora: 32 million loyalty members, $1.2B in loyalty-driven revenue
- Ulta Beauty: 32 million members, 85% of sales from loyalty
- Glossier: 100% direct-to-consumer, $100M+ revenue with zero paid media
- The Ordinary: 3.2 million email captures via QR codes, 47% conversion
- Fenty Beauty: 2.8 million loyalty program members, 340% engagement increase
Your First-Party Data Action Plan
Immediate Wins (Next 90 Days)
- Audit current data assets: What do you have? What’s missing?
- Implement QR codes on top 20 SKUs: Start capturing data at product interaction point
- Launch email segmentation: Move from blast emails to personalized, segmented campaigns
- Optimize loyalty program: Add experiential rewards and gamification
- Begin SMS/MMS program: Start with high-value segments
Foundation Building (Months 4-9)
- Scale QR code program: Expand to full product portfolio
- Enhance data capture: Progressive profiling, zero-party data collection
- Integrate channels: Unified customer profiles across email, SMS, app, in-store
- Launch mobile app (if applicable): Rich data and deep engagement
- Implement predictive analytics: Next purchase prediction, churn prevention
Innovation and Scale (Months 10-18)
- Advanced personalization: Dynamic content, individualized recommendations
- Emerging channels: WhatsApp, AR/VR, voice assistants
- Partner ecosystem: Retail collaborations, data partnerships
- Continuous optimization: A/B testing, performance measurement, refinement
The Post-Cookie Future is First-Party
The third-party cookie era is over. Beauty brands that depended on cheap behavioral targeting are facing an existential crisis.
But for brands willing to invest in direct customer relationships, this is the greatest opportunity in a generation.
The beauty brands winning in 2025 and beyond:
- Own their customer data — not rented from platforms
- Provide genuine value — not just discounts and promotions
- Build trust through transparency — not creepy tracking
- Create personalized experiences — not generic blasts
- Focus on lifetime value — not one-time transactions
The question isn’t whether you can afford to build a first-party data strategy.
The question is: Can you afford not to?
Every day you delay is a day competitors capture your potential customers — customers who will cost 3-5x more to acquire later, if you can reacquire them at all.
Start building your first-party data ecosystem today. Your future self (and your CFO) will thank you.
Ready to build a comprehensive first-party data strategy for your beauty brand?
Book a Demo → See how Caramel’s AI platform unifies customer data across channels, powers intelligent segmentation, and automates personalized journeys that drive 340% higher engagement and 2.8x customer lifetime value.
Quick Navigation
Get in Touch
Have questions about implementing these strategies? Let's discuss how Caramel can help your business.
Related Blogs
See All Blog
Caramel vs Mailmodo: When AMP Emails Are Not Enough for a Real B2C CRM
Mailmodo earned a real place in the email marketing market by doing one thing well: making emails interactive. Forms, polls, quizzes, calend

Personalisation at Scale: How AI Delivers 1-to-1 Marketing Without 1-to-1 Human Effort
Personalisation is the word the marketing industry has used for fifteen years to describe everything from inserting a first name into an ema

Compliance by Design: KYC, AML and Cross-Border Rules Handled by Your AI Agent
International buyers generate compliance obligations that domestic buyers do not. This is not a regulatory inconvenience — it is a structura
Stop Paying Commissions. Start Building Relationships.
Join forward-thinking businesses reclaiming their customer data from third-party platforms. Build direct connections, increase loyalty, and keep 100% of your revenue.